Correlations, Causations, and Data Over Time
By Elisabetta Tola / 3 minute read
It’s not uncommon to see stories saying something like, “Antidepressant prescriptions have risen in the past 20 years,” or “The number of people who do not have access to clean water has shrunk in the past 10 years.” However, comparing data over time demands careful consideration. The meaning of given numbers might well vary on the basis of the moment they are measured. Money is a classic example: financial comparisons must consider inflation; otherwise it’s impossible to draw any meaningful conclusions.
To calculate the impact of inflation, use the U.S. Bureau of Labor Statistics’ Consumer Price Index inflation calculator.
The issue, of course, extends far beyond the financial realm. Plenty of other factors can determine data quality when looked at over time. Another example: Diagnostic capabilities have improved over the years for a wide variety of health conditions. Reporting on the increase or decrease in the prevalence of a disease compared with a time when data weren’t available or were measured with different standards makes little sense.
When we do see figures change over time, the natural question to ask is, “Why?”
In answering that question, scientists often use an array of statistical tests called regression analyses to see if they can establish a link between two variables. The most common way to express such a correlation is to use the index r, which goes from -1 to +1. There are negative correlations, in which one variable grows while the other one decreases, and positive ones, in which both variables move in the same direction.
For example, there is a negative correlation between rising temperatures and the use of heating oil. Likewise, there is a positive correlation between rising temperatures and the use of electricity (for air conditioning). Weak correlation values are closer to zero; strong correlations are closer to the extremes of -1 or +1.
However, just because two things are correlated doesn’t mean they have anything to do with each other. Tyler Vigen presents a number of what he calls spurious correlations on his website and book of the same name. He shows real data that create absurdly false correlations, such as the close correlation of the divorce rate in Maine and per capital consumption of margarine.

Vigen’s charts demonstrate two common mistakes with correlations. The first is the tendency to draw conclusions about individuals from a set of data describing a population — something known as an ecological fallacy, which the statistician Heather Krause explains in a YouTube video:
As an example, it’s generally true that there is a correlation between income level and life expectancy in the general population. However, it is not true that every rich person will live longer than every poor person, or that a very old and healthy person must also be wealthy.
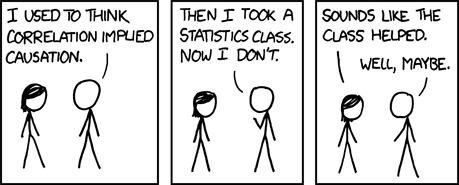
The second common mistake is misinterpreting a correlation for causation. There might be many explanations behind the reason that variables are related. For example, there is causation in terms of rising temperatures and the decreased use of heating oil. But there is not causation between the decreased use of heating oil and the increased use of swimming pools. In the latter case, a third variable — rising temperatures — explains the apparent relationship.
To establish a causal relationship, scientists wade into statistics and perform complex tests on their data. To confirm a causal effect and rule out all other possible explanations, they must craft experimental studies using randomized designs and control groups. This is particularly important in fields such as environmental epidemiology, in which researchers want to understand whether a particular pollutant might be the cause of a disease. It is complicated to find a unique relationship between the presence of one substance and its impact on the population’s health. We live in a complex environment, and many factors are at play: lifestyle, nutritional status, previous conditions, and genetic predisposition, among others.


